
Resting State FMRI
> research > Resting State FMRI
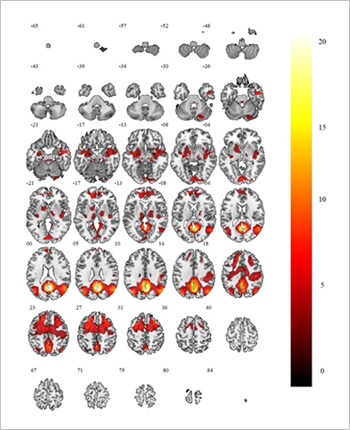
Resting state functional MRI is a relatively new and powerful method for evaluating regional interactions that arise when a subject is not performing an explicit task. Low frequency (<0.1 Hz) BOLD fluctuations often show strong correlations at rest even in distant gray matter regions. Fluctuations in spontaneous neural activity are assumed to underline the BOLD fluctuations, though the exact mechanisms giving rise to the neural fluctuations remain unclear.
The spatial patterns of R-fMRI correlations are stable, in that they are similar across multiple ÔÇśrestingÔÇÖ states, such as eyes-open, eyes-closed, and fixation and across individuals and sessions. Several methods have been proposed to acquire and analyze resting state fMRI data. A major goal of laboratory is to find optimal combinations of methods to brain regions and understand relationships between them.
This entails optimization of many aspect of data acquisition (scan duration, spatial resolution, spatial smoothing during pre-processing) and data analysis (seed-based approaches and independent component analysis approaches).
1. Seed based Analysis
Seed-based analysis is the most commonly used method for observing the network and connectivity of the brain. In fMRI studies, signal of particular voxel or cluster, known as a seed or ROI, is used to compute correlations with other voxels. This provides a much more accurate and detailed observation of the specific connection of the brain area of interest. Applications of seed-based analysis to characterize dormant networks include partial correlation, coherence and partial coherence, phase relationships, clustering, and graph theory.


2. Independent Component Analysis (ICA)
Independent component analysis attempts to decompose multivariate signals into independent signals. For example, a sound is usually a numeric signal whenever there are signals from multiple sources. Then the question is whether you can separate these contributing sources from the overall observed signal. If the statistical independence assumption is true, blind ICA separation of the mixed signal gives very good results. The important thing to consider is that if you have the source, you need at least observation to recover the original signal in fMRI analysis.


3. Power Spectral Density (PSD)
Power spectrum of the time series represents power distribution of the frequency components that make up the signal. According to Fourier analysis, physical signals can be decomposed into frequencies on several discrete frequencies or continuous frequency ranges. The statistical mean of a particular signal including noise analyzed as a frequency component called a spectrum. Any Signals that can be represented by time varying amplitudes have corresponding frequency spectra. This includes familiar elements such as visible light, music sound, radio, TV and even regular rotation of the Earth. When looking at these signals in the form of a frequency spectrum, certain aspects of the received signals or the underlying processes producing them are revealed.

Resting state functional MRIŰŐö Ýö╝ÝŚśý×Éŕ░Ç ÝŐ╣ýἠTaskŰą╝ ýłśÝľëÝĽśýžÇ ýĽŐýŁä ŰĽî ýŁ╝ýľ┤ŰéśŰŐö ŰçîýŁś ýśüýŚşŰ│ä ýâüÝśŞý×ĹýÜęýŁä ÝĆëŕ░ÇÝĽśŰŐö ŰŹ░ ýéČýÜęŰÉśŰŐö Ű╣äŕÁÉýáü ýâłŰíşŕ│á ŕ░ĽŰáąÝĽť ŰÂäýäŁ Ű░ęŰ▓Ľý×ůŰőłŰőĄ.
Űé«ýŁÇ ýú╝Ýîîýłś ýśüýŚşŰîÇýŁś BOLD ýőáÝśŞŕ░Ç Gray matterýŁś ýŁ╝ŰÂÇ ýśüýŚşŰôĄ ŕ░äýŚÉ ŰćĺýŁÇ ýâüŕ┤Çýä▒ýŁä ŕ░ÇýžÇŕ│á ýžäŰĆÖÝĽśŰę░, ýőáŕ▓ŻÝĽÖýáü ýőáÝśŞýÖÇ ýŁ┤ŰčČÝĽť Űé«ýŁÇ ýú╝Ýîîýłś ýśüýŚşŰîÇýŁś ýőáÝśŞŕ░Ç ýáĽÝÖĽÝ׳ ýľ┤ŰľĄ Űęöý╗ĄŰőłýŽśýť╝Űíť Ű░ťýâŁÝĽśŰŐöýžÇýŚÉ ŰîÇÝĽ┤ýäťŰŐö ýŚČýáäÝ׳ ۬ůÝÖĽÝĽśýžÇŰŐö ýĽŐýŐÁŰőłŰőĄ.
1. Seed based Analysis
seed-based ŰÂäýäŁýŁÇ ŰçîýŁś ŰäĄÝŐŞýŤîÝüČýÖÇ ýŚ░ŕ▓░ýä▒ýŁä ŕ┤Çý░░ÝĽśŰŐö ŰŹ░ ŕ░Çý׹ ýŁ╝Ű░śýáüýť╝Űíť ýéČýÜęŰÉśŰŐö Ű░ęŰ▓Ľý×ůŰőłŰőĄ. fMRI ýŚ░ŕÁČýŚÉýäť ýÜ░ŰŽČŕ░Ç ýŤÉÝĽśŰŐö ÝŐ╣ýἠŰ│ÁýůÇ(voxel) ŰśÉŰŐö Ýü┤ŰčČýŐĄÝä░(cluster)ýŁś ýőáÝśŞýÖÇ ŰőĄŰąŞ Ű│ÁýůÇŕ│╝ýŁś ýâüŕ┤Ç ŕ┤Çŕ│äŰą╝ ŕ│äýé░ÝĽśŕŞ░ ýťäÝĽśýŚČ ýéČýÜęŰÉśŰę░, ÝŐ╣Ý׳ ŰçîýŁś ÝŐ╣ýἠýśüýŚşýŚÉ ŰîÇÝĽśýŚČ ŰőĄŰąŞ ýťäý╣ś ŰśÉŰŐö ŰäĄÝŐŞýŤîÝüČŕ░ä Ű»Şý╣śŰŐö ýśüÝľąýŁä ŰÂäýäŁÝĽśŰŐöŰŹ░ ýťáŰŽČÝĽęŰőłŰőĄ. seed-based ŰÂäýäŁýŁś ýŁĹýÜęýť╝ŰíťŰŐö ŰÂÇŰÂä ýâüŕ┤Ç ŕ┤Çŕ│ä(partial correlation), ýŁ╝ŕ┤Çýä▒(coherence), ýťäýâü ŕ┤Çŕ│ä(phase relationships), Ýü┤ŰčČýŐĄÝä░Űžü(clustering) Ű░Ć ŕĚŞŰלÝöä ýŁ┤Űíá(graph theory)ýŁ┤ ý׳ýŐÁŰőłŰőĄ.
2. Independent Component Analysis (ICA)
ŰĆůŰŽŻýä▒ŰÂäŰÂäýäŁ(Independent component analysis)ýŁÇ ŰőĄŰ│ÇŰčë ýőáÝśŞŰą╝ ŰĆůŰŽŻ ýőáÝśŞŰíť ŰÂäÝĽ┤ÝĽśŰŐö Ű░ęŰ▓Ľý×ůŰőłŰőĄ. ýśłŰą╝ ŰôĄŰę┤ ýÜ░ŰŽČŕ░Ç ŰôúŰŐö ŰůŞŰלŰŐö ýŚČŰčČ ýŁîýŤÉýŁ┤ ýä×ýŚČ ŰžîŰôĄýľ┤ýžä Ýś╝ÝĽęýŤÉý×ůŰőłŰőĄ. ŰĆůŰŽŻýä▒ŰÂäŰÂäýäŁýŁÇ ŕĚŞ Ýś╝ÝĽęýŤÉýť╝ŰíťŰÂÇÝä░ ŕ░üŕ░üýŁś ýŁîýŤÉýŁä ŰÂäŰŽČÝĽśŰŐöŰŹ░ ŰžîýĽŻ ÝćÁŕ│äýáü ŰĆůŰŽŻýŁ┤ ŕ░ÇýáĽŰÉťŰőĄŰę┤ Ýś╝ÝĽę ýőáÝśŞýŁś ŕ░üŕ░üýŁś ŰĆůŰŽŻýä▒ŰÂä ýÂöýÂťýŁÇ ŰžĄýÜ░ ŰćĺýŁÇ ýőáŰó░ŰĆäýŁś ŕ▓░ŕ│╝Űą╝ ýľ╗ýŁä ýłś ý׳ýŐÁŰőłŰőĄ. ŕĚŞŰčČŰéś ŕ│áŰáĄÝĽ┤ýĽ╝ ÝĽá ýĄĹýÜöÝĽť ŕ▓âýŁÇ ŰĆůŰŽŻýä▒ŰÂäŰÂäýäŁýŁ┤ ýťáýŁśÝĽśŕ▓î ý×ĹýÜęÝĽśŕŞ░ ýťäÝĽśýŚČ ÝćÁŕ│äýáüýť╝Űíť ýÁťýćîÝĽťýŁś ýŤÉ ýőáÝśŞýŁś ýâśÝöîýŁś ŕ░ťýłśŕ░Ç ýÜöŕÁČŰÉęŰőłŰőĄ.
3. Power Spectral Density (PSD)
ýőťŕ░äýŚÉ Űö░ŰąŞ ýáäŰáąŰÂäÝĆČ(power spectrum)ýŁÇ ýú╝ÝîîýłśýŚÉ Űö░ŰąŞ ýőáÝśŞýŁś ŕÁČýä▒ýä▒ŰÂäýŁś ŰÂäÝĆČŰíť ŰéśÝâÇŰé╝ ýłś ý׳ýŐÁŰőłŰőĄ. ÝôĘŰŽČýŚÉ ŰÂäýäŁýŁä ÝćÁÝĽśýŚČ ŰČ╝ŰŽČýáüýŁŞ ýőáÝśŞŰŐö ýŚČŰčČŕ░ťýŁś ŕ░ťŰ│ä ýú╝Ýîîýłś ŰśÉŰŐö ýŚ░ýćŹ ýú╝ÝîîýłśŰíť ŰéśŰëśýľ┤ ýžłýłś ý׳ýť╝Űę░ ý×íýŁîýŁä ÝĆČÝĽĘÝĽť ýú╝Ýîîýłś ýä▒ŰÂäýŁś ÝćÁŕ│äýáü ÝĆëŕĚáýŁä ýáäŰáą ŰÂäÝĆČŰŁ╝ŕ│á ÝĽá ýłś ý׳ýŐÁŰőłŰőĄ. ýőťŕ░äýŚÉ Űö░ŰŁ╝ ýäŞŕŞ░ýŁś Ű│ÇŰčëýŁä ŕ░ÇýžÇŰŐö ۬ĘŰôá ýőáÝśŞŰŐö ŰÂäÝĆČŰą╝ ŕ░Çýžł ýłś ý׳ŰŐöŰŹ░, ýÜ░ŰŽČŕ░Ç ýŁÁýłÖÝĽť ŕ░Çýőťŕ┤Ĺýäá, ŰůŞŰל ýćîŰŽČ, ŰŁ╝ŰööýśĄ, TV, ýőČýžÇýľ┤ ýžÇŕÁČýŁś ŕ│Áýáäŕ╣îýžÇŰĆä ŰÂäÝĆČŰĆäŰą╝ ŕ░Çýžł ýłś ý׳ýŐÁŰőłŰőĄ. ýú╝Ýîîýłś ŰőĘýťäŰíť ýŁ┤ŰčČÝĽť ýőáÝśŞŰôĄýŁä Ű│╝ ŰĽî ýŁ┤ýáäýŚÉŰŐö ýŁŞýžÇÝĽśýžÇ ۬╗ÝľłŰŹś ýőáÝśŞŰôĄýŁś ÝŐ╣ýἠýŞíŰę┤ŰôĄýŁä Ű░ťŕ▓Č ÝĽá ýłś ý׳ŰŐö ŰÂäýäŁŰ▓Ľý×ůŰőłŰőĄ.
![]()
601, 515-3, Hakjeong-dong, Buk-gu, Daegu 702-911, Republic of KOREA | Tel : +82-53-950-4128, 4129 | e-mail : ychang@knu.ac.kr
Copyright(c) 2016 Kyungpook National University School of Medicine BMR lab. All rights reserved.